


The Surprising Impact of Missing NBA Stars: How Deep Do Lineup Struggles Really Go?
Ever notice how in the playoffs, NBA teams scramble to keep their stars glued to the court, but during the grueling regular season, lineups can look like a game of musical chairs? It’s fascinating — and a bit baffling — to see just how much a team’s fortunes wobble when marquee players are sidelined. Remember that game on March 17? The Golden State Warriors, riding a hot streak, favored to roll over a Denver Nuggets team missing Nikola Jokic and Jamal Murray… and yet, the Nuggets pulled off an upset. What gives? Is it just a fluke, or does missing star power during the regular grind sometimes mask deeper truths about team toughness and strategy? Heck, the Oklahoma City Thunder are practically rewriting the rulebook, winning big when missing two of their top three players. So, how much do NBA lineups really miss their stars during the regular season — and do rivals underestimate these “underdog” squads? Let’s dive headfirst into some eye-opening data and surprising stories that challenge what we think we know about star power in the NBA. LEARN MORE
During the postseason, itâs best for NBA lineups to be at full strength. Itâs not always possible across the long regular season. Weâre looking at the impact when star players are missing.
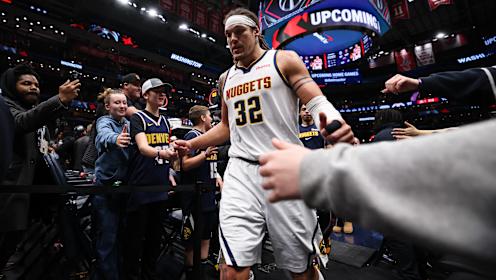
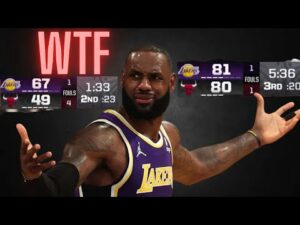
On March 17, the Golden State Warriors, who were red hot with seven straight wins and 12 over a 13-game stretch, hosted a Denver Nuggets squad that was without its two best players, Nikola Jokic and Jamal Murray.
This should have been an automatic victory, right?
Apparently not, because the Nuggets beat the Warriors 114-105.
Still, it was the kind of result regarding NBA lineups to send data-driven brains down a rabbit hole.
Did you know the Oklahoma City Thunder are 7-1 this season when two of their three best players â Shai Gilgeous-Alexander, Chet Holmgren and Jalen Williams â are missing? Or that this same Thunder team has won more often against teams that have their stars in the lineup (84% of the time) than against teams that are missing them (75%)?

Obviously, in the NBA postseason, a team generally needs its best players to be available to advance to the next round.
But what about the regular season? Are teams better when their best players are missing? Do opponents underestimate NBA lineups that are missing their stars?
Parameters for Answering These Questions
A lineup missing players can be due to different reasons, particularly injuries, but sometimes load management/general rest or other factors.
For this exercise, we looked at how teams played without their stars (we are calling this part âTeam Starlessâ and how they played against teams without their stars (âOpponent Starlessâ).
To quantify when a team/opponent is starless, we looked at games in which at least two of their three top players (based on our DRIP metric) did not play. This isnât a perfect method â for instance, the 2014-15 Miami Heatâs three best players according to DRIP were Chris Bosh, Dwayne Wade, and⦠Josh McRoberts â but itâs the most objective way to do it.
We also made sure to account for any midseason trades that took place in these seasons. So for the first part of the season, the 2024-25 Los Angeles Lakersâ three best players were Anthony Davis, LeBron James and Austin Reaves, and now, those players are Luka Doncic, James and Reaves.
To avoid undermining our analysis with teams that played little/no starless games, we filtered out all teams that did not play at least five games without two of their three best players in a given season.
We also calculated win percentage difference by subtracting/adding their starless/opponent starless win percentage by their season-long win percentage.
Lastly, weâre looking back to 2012 and the start of DRIP database.
With these parameters, let’s take a look at the results.
NBA Lineups: Let the Stars Shine
A quick data interpretation lesson for the less fluent out there: The Pearson correlation coefficient (r) is the most common way of measuring a linear correlation. The ârâ is a number between -1 and 1 that determines the strength/direction of a correlation between two variables. If an ârâ coefficient is close to 1 or -1, it indicates a strong positive/negative correlation. If the ârâ is closer to 0, that means the correlation is weak/nonexistent.
In this instance, we found a strong positive correlation (r = 0.67) between a teamâs overall win percentage and the win percentage in games when itâs without at least two of its three best players. There was also a strong positive correlation (r = 0.71) between a teamâs overall win percentage and the win percentage in games when the opponent is playing without at least two of its three best players.
(Note: This correlation is telling us about teams’ relationships to each other, not the relationship between their overall record and starless/opponent starless records. So with the Team Starless category, we have a sturdy correlation between how good a teamâs overall record is and how well it performs without its stars, such as the 2024-25 Thunder performing so well without their top players.)
And for the Opponent Starless group, we have an even stronger correlation between how good a teamâs overall record is and how well it performs against undermanned teams. This suggests the stronger the team, the more likely it is to capitalize on opponents that are less than full strength.
As for the main questions posed earlier, it appears that a situation like the Warriorsâ loss to the depleted Nuggets is more of an isolated incident rather than a common trend. Since the 2012-13 season, teams that were missing their stars have experienced an average decrease in their win percentage of 9.1% â meaning their win percentage in starless games is 9.1% lower than their overall win record for that season.
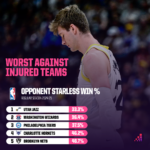
As for teams playing starless opponents, on average teams win games at a 14.7% rate higher than their overall win percentage.
In this specific case, it seems that conventional wisdom wins out. Teams are worse when they are playing without their best players, and they have a better chance of winning when they are facing NBA lineups that donât have their top ponies in the stable.
Interesting/Bizarre Individual Cases
Before we conclude this study on NBA lineups, we thought weâd share some of the more bizarre individual examples yielded from our inquiry.
For starters, the 2012-13 Atlanta Hawks were a pretty good team, finishing sixth in the Eastern Conference and pushing the formidable Indiana Pacers to six games in their first-round playoff matchup. However, for some reason, they struggled to win the easy games, taking only 16.7% of matchups against starless teams (37% worse than their overall record for that season).

The 2016-17 season was a rebuilding season for the Brooklyn Nets, who went an NBA-worst 20-62. But unlike the 2012-13 Hawks, they knew how to beat a hobbled opponent, winning 80% of their games against starless opponents (55.6% better than their overall record).
The 2016-17 Cleveland Cavaliers went to the NBA Finals after being a very top-heavy team in the regular season. They didnât win any of their seven starless games that season. Yeah, wild.
Last but not least, the 2014-15 Detroit Pistons were very forgettable â 32-50 and not even close to making the playoffs. It wasnât because they didnât have depth like the 2016-17 Cavaliers, though. The Pistonsâ starless win percentage (.636) was actually 24.6% better under the formula than their overall win rate (.390).
Like this? Follow along on Instagram, Bluesky, Threads, Facebook and X for more.
The post Tank’s Not Full: How Much Do NBA Lineups Miss Star Players in the Regular Season? appeared first on Opta Analyst.
CHECK OUT THE HOTTEST DEALS ON AMAZON!
2025 Panini SCORE Football EXCLUSIVE HUGE Factory Sealed MEGA Foil Pack with 15 Brand New Cards Including ROOKIES & PARALLEL! Look for Travis Hunter,Jaxson Dart, Ashton Jeanty,Cam Ward & Many More!
$11.95 (as of January 29, 2026 15:02 GMT +00:00 - More infoProduct prices and availability are accurate as of the date/time indicated and are subject to change. Any price and availability information displayed on [relevant Amazon Site(s), as applicable] at the time of purchase will apply to the purchase of this product.)
2025 Panini Prizm Draft Picks Football HOBBY BLASTER box (6 pks/bx)
$55.99 (as of January 29, 2026 15:04 GMT +00:00 - More infoProduct prices and availability are accurate as of the date/time indicated and are subject to change. Any price and availability information displayed on [relevant Amazon Site(s), as applicable] at the time of purchase will apply to the purchase of this product.)
2025 Panini Football Sticker and Card Collection Gift Lot 5 Sealed Packs 25 Stickers and 5 Cards Total Possible Rookies and Stars Patrick Mahomes, Jaxson Dart, Shadeur Sanders Plus 2026
$16.99 (as of January 29, 2026 15:04 GMT +00:00 - More infoProduct prices and availability are accurate as of the date/time indicated and are subject to change. Any price and availability information displayed on [relevant Amazon Site(s), as applicable] at the time of purchase will apply to the purchase of this product.)
2023 Topps Series Two Baseball Trading Cards, 3 Packs, 16 Cards per Pack, 48 Cards Total
$19.99 (as of January 29, 2026 15:04 GMT +00:00 - More infoProduct prices and availability are accurate as of the date/time indicated and are subject to change. Any price and availability information displayed on [relevant Amazon Site(s), as applicable] at the time of purchase will apply to the purchase of this product.)
2025 Topps Chrome Update Baseball Sealed Mega Box (Look for Exclusive X-Fractor Parallels) IN HAND TO SHIP
$64.00 (as of January 29, 2026 15:04 GMT +00:00 - More infoProduct prices and availability are accurate as of the date/time indicated and are subject to change. Any price and availability information displayed on [relevant Amazon Site(s), as applicable] at the time of purchase will apply to the purchase of this product.)
Lamine Yamal #74 Facsimile Signed Reprint Laser Autographed Funko POP! Soccer FC Barcelona Figurine with Protector Case
$29.99 (as of January 29, 2026 15:04 GMT +00:00 - More infoProduct prices and availability are accurate as of the date/time indicated and are subject to change. Any price and availability information displayed on [relevant Amazon Site(s), as applicable] at the time of purchase will apply to the purchase of this product.)
2025 Topps Allen and Ginter Baseball, 48 Trading Card, Look for Autograph and Relic Cards
$49.99 (as of January 29, 2026 15:04 GMT +00:00 - More infoProduct prices and availability are accurate as of the date/time indicated and are subject to change. Any price and availability information displayed on [relevant Amazon Site(s), as applicable] at the time of purchase will apply to the purchase of this product.)
New England Patriots 2025 Donruss Factory Sealed Team Set Featuring a Drake Maye 2nd Year Card and Stefon Diggs with Kyle Williams, TreVeyon Henderson and Will Campbell Rated Rookie Cards Plus
$24.99 (as of January 29, 2026 15:02 GMT +00:00 - More infoProduct prices and availability are accurate as of the date/time indicated and are subject to change. Any price and availability information displayed on [relevant Amazon Site(s), as applicable] at the time of purchase will apply to the purchase of this product.)
100 Vintage Baseball Cards in Old Sealed Wax Packs - Perfect for New Collectors
$14.99 (as of January 29, 2026 15:02 GMT +00:00 - More infoProduct prices and availability are accurate as of the date/time indicated and are subject to change. Any price and availability information displayed on [relevant Amazon Site(s), as applicable] at the time of purchase will apply to the purchase of this product.)


Post Comment